
A remote patient monitoring dashboard is where home readings turn into clinical decisions. Blood pressure, weight, glucose and oxygen readings arrive from a patient’s home, and the care team needs to see what matters, decide what to do, and document it. A well-built RPM dashboard makes that work fast and clear. A poorly built one buries staff in numbers and alerts.
This guide covers what a good dashboard shows, how it fits into daily workflow, and why the path data takes from the device to the patient record matters as much as the screen itself. It also explains how Tenovi readings flow into eClinicalWorks (eCW), so staff can review trends and act without switching systems.
What Is a Remote Patient Monitoring Dashboard?
Remote patient monitoring (RPM) uses connected medical devices to collect physiologic data at home and send it to a care team. The dashboard is the view where that data lands. It groups readings by patient, flags values outside set limits, charts trends over time, and tracks the activity a program needs to document.
The Centers for Medicare & Medicaid Services (CMS) sets the ground rules. Its telehealth and remote monitoring booklet states that the device must meet the FDA definition of a medical device, and that practices must “electronically collect physiologic data and automatically upload it to a secure location.” CMS also requires patient consent and an established patient relationship for RPM. A dashboard sits on top of that automatic upload. If the upload depends on a patient syncing an app or pairing over Wi-Fi, gaps show up on the dashboard as missing days.
Where the Data Comes From
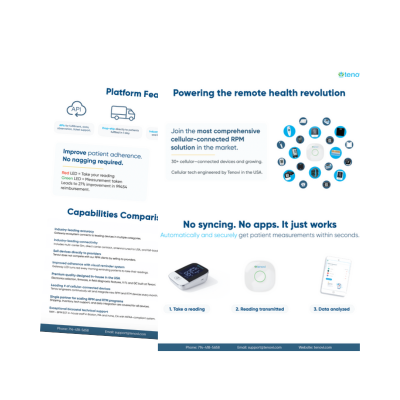
Every dashboard depends on what feeds it. Readings need to arrive on time, tagged to the right patient, and in a consistent format. That starts with the device and the connection. Tenovi offers 60+ cellular-connected devices, either through the Tenovi Gateway or SIM-embedded devices. Patients take a reading as they normally would. There are no apps, no syncing and no Wi-Fi setup. The reading travels over cellular to the Tenovi Cloud, and from there it can reach any platform connected through one API.
This helps care team in a practical way. When readings arrive automatically, the dashboard reflects what the patient actually did. Staff spend less time chasing missing data and more time on the readings that need a clinical look.
How Tenovi Readings Reach eClinicalWorks
Many practices run RPM in a separate portal from their electronic health record (EHR). Staff log in to one system to review readings, then open another to document, message or adjust care. Values get copied by hand. Context gets lost between screens.
Tenovi has partnered with eClinicalWorks to close that gap. Here is how the data moves:
- The patient takes a reading at home. A blood pressure cuff, scale, glucose meter or pulse oximeter sends the reading over cellular.
- The reading reaches the Tenovi Cloud. Tenovi receives the data, ties it to the right device and patient, and handles device provisioning and support behind the scenes.
- The reading flows into eCW. Through the integration, readings appear in the eCW dashboard and the patient record.
- Staff review and act in one place. The care team sees trends next to the rest of the chart, then follows up, documents and adjusts the care plan without leaving eCW.
No one re-keys a blood pressure value. No one toggles between tabs to compare today’s weight with last month’s medication change. The reading and the chart live together.
The Office of the National Coordinator for Health IT (now ASTP/ONC) describes the core problem well. Its patient engagement playbook notes that clinicians “usually can’t access” patient-generated health data, and even when they can, they “just don’t have the time to sort through it all.” Pulling that data into the EHR, where it can be “organized and visualized,” is the step it points to. The eCW integration puts that step into practice for Tenovi readings.
What an Effective RPM Dashboard Shows
A dashboard should answer a few questions quickly. Who needs attention today? Is this patient trending better or worse? Is the program on track for the month? These features help answer them.
Alerts That Point to Proactive Care
Alerts should surface readings that need a clinical response. They should not fire on every borderline value. Each alert should show the reading, the threshold it crossed, and recent history so staff can judge urgency at a glance.
Thresholds Set by Patient or Group
Default thresholds are a starting point. A patient with resistant hypertension and a patient newly started on a medication may need different limits. Clinicians should be able to set and adjust thresholds for an individual or a patient group, with changes recorded.
Trends Over Time
A single high reading means less than a two-week climb. Trend charts help staff spot gradual weight gain in heart failure, rising fasting glucose, or a blood pressure that has settled after a dose change. Trends also give clinicians something concrete to share with patients during check-ins.
Days of Data
CMS states that practices must collect data for “2-15 or 16+ days out of 30 days, depending on the code descriptor.” A dashboard should count transmission days per patient in each 30-day period. It should also flag patients who are falling behind early, while there is still time to help them.
Reimbursement information is provided for educational purposes only and is not legal, compliance, billing, coding, or reimbursement advice. Coding, coverage, and payment vary by payer and locality and are subject to change. Coverage or payment is not guaranteed; consult applicable payer guidance and qualified advisors. CPT® is a registered trademark of the American Medical Association.
Time Tracking
RPM management requires documented time, including interactive communication with the patient. A dashboard should log review and communication time per patient and per month. Manual timers and spreadsheets invite errors. Built-in tracking keeps documentation accurate and audit-ready.
Adherence Signals
Missed readings are often the first sign that a patient is struggling. A clear view of who has not transmitted in several days lets staff reach the patient before engagement drops off. Device design helps here too. The Tenovi Gateway shows a reminder light that changes once a reading is sent, which supports patient adherence without an app.
Alert Fatigue and How Dashboards Help
More data can mean more noise. A 2025 study in JMIR Medical Informatics looked at one year of a hospital hypertension telemonitoring program. Among 174 users, the program logged 30,184 measurements and 17,293 alerts. About 79% of alerts were processed automatically, but nurses still handled 3,646 by hand.
The findings point to several practical lessons:
- Most manual work was administrative. Of 2,101 manual actions, 77% were administrative and 23% were clinical.
- A small group drove much of the workload. About 15% of users accounted for 45% of monitoring actions.
- Threshold settings had a large effect. In the study’s modeled scenario, raising the systolic alert threshold to 180 mmHg cut alerts by 54% with a small rise in clinical actions.
The authors note that broader thresholds may not suit every population, and clinical judgment should guide any change. Still, the lesson for dashboard design is clear. Configurable thresholds, automated handling of routine alerts, and patient-level settings help nurses focus on readings that need them.
When alerts live inside the EHR, staff also skip the extra step of opening a second system to check history. That saves time on every alert, not just the urgent ones.
Building the Dashboard Into Daily Workflow
A dashboard only helps if it fits how the team works. A few practices make a difference:
- Set a review rhythm. Many teams review alerts at set times each day and look at trends weekly.
- Assign clear roles. Decide who triages alerts, who calls patients, and who escalates to a clinician.
- Document where care happens. When readings sit in the patient record, notes and orders stay in one place.
- Start small. ASTP/ONC suggests piloting with a group of patients who have a chronic condition, then adjusting before expanding.
- Train both sides. Staff need to know the dashboard. Patients need to know their devices. Thoughtful patient onboarding sets both up well.
RPM also works alongside other programs. Practices that offer chronic care management often use the same care team, so keeping data in one place reduces duplicate work.
Integration Through One API
Some programs build their own software. Others use an EHR such as eCW or a dedicated RPM platform. In each case, the device layer should not be the hard part.
Tenovi connects devices to platforms through one API. A program can offer blood pressure monitors, scales, glucose meters, pulse oximeters, thermometers, peak flow meters and more without building a new integration for each device. We handle fulfillment, provisioning and support, so devices ship ready to use and patients do not need to configure anything.
For care teams, the result is simple. Readings arrive in a consistent format, in the system staff already use, from every device in the care plan.
Frequently Asked Questions About Remote Patient Monitoring Dashboards
This section answers common questions from providers and care teams about how a remote patient monitoring dashboard works, what it should track, and how it connects to the EHR.
1) What is a remote patient monitoring dashboard?
It is the screen where a care team reviews readings sent from connected medical devices at home. It groups data by patient, flags readings outside set thresholds, shows trends over time, and tracks the activity a program needs to document.
2) What is the difference between an RPM dashboard and an EHR?
An RPM dashboard focuses on device readings, alerts and monitoring activity. An EHR holds the full patient record. When the two are integrated, as with Tenovi and eClinicalWorks, readings appear in the patient record so staff can review and act without switching systems.
3) How do Tenovi readings get into eClinicalWorks?
The patient takes a reading on a cellular-connected Tenovi device. The reading travels to the Tenovi Cloud and then flows into the eCW dashboard and patient record. Staff review trends and document follow-up in eCW without re-keying data.
4) How can a dashboard help reduce alert fatigue?
Configurable thresholds, patient-level settings and automated handling of routine alerts reduce the number of alerts nurses review by hand. A 2025 study in JMIR Medical Informatics found that threshold adjustments could cut blood pressure alerts by about half in a modeled scenario.
5) Why does a dashboard track days of data?
CMS requires that RPM data be collected for a set number of days in each 30-day period, depending on the code. Tracking transmission days helps staff see which patients need a reminder before the period ends.
6) Do patients need an app or Wi-Fi for Tenovi devices?
No. Tenovi devices connect over cellular through the Tenovi Gateway or a built-in SIM. Patients take readings as usual, and data sends automatically without apps, syncing or Wi-Fi.
Understanding Remote Patient Monitoring Dashboards
A remote patient monitoring dashboard should help care teams see who needs attention, follow trends, and keep accurate records of days and time. The best setups pair clear alerts and adjustable thresholds with reliable data that arrives automatically. When readings flow straight into the EHR, as they do through the Tenovi and eClinicalWorks integration, staff review and act in one place.
Tenovi provides 60+ cellular-connected devices, one API, and the fulfillment, provisioning and support behind them. Care that goes home with the patient. To see how Tenovi can fit your workflow, contact us for a free demo and consultation.